
Data Visualization & Reporting: Transforming Data into Actionable Insights
In today's data-rich environment, simply collecting data isn't enough. The true power lies in understanding and communicating its story effectively. Our Data Visualization & Reporting services are designed to transform complex, disparate datasets into clear, concise, and compelling visual narratives that drive strategic decision-making.
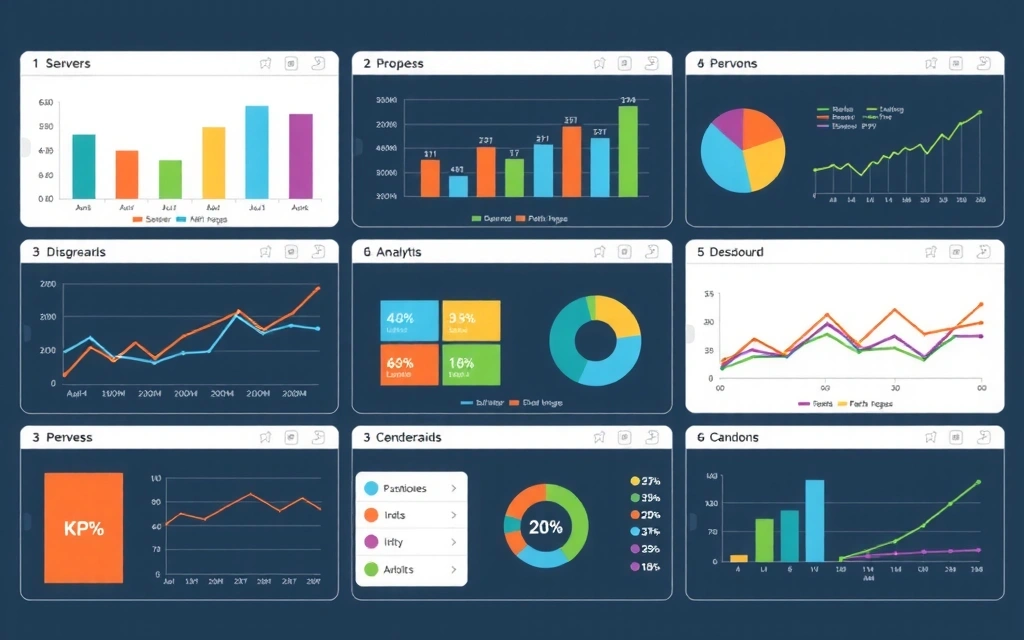
We specialize in creating intuitive dashboards and comprehensive reports that highlight key trends, identify opportunities, and pinpoint areas for improvement. Our approach ensures that every stakeholder, from executive leadership to operational teams, can easily grasp critical information and act with confidence.
- Interactive Dashboards: Dynamic, real-time dashboards tailored to your specific KPIs and business needs, offering drill-down capabilities for deeper insights.
- Custom Reports: Bespoke reports designed to address unique business questions, presenting findings in an easy-to-understand format with actionable recommendations.
- Data Storytelling: Crafting compelling narratives around your data, using visuals and context to explain complex findings and influence decisions.
- Performance Monitoring: Setting up robust systems for continuous tracking and reporting of key performance indicators across your organization.
Our Approach to Data Visualization
Understanding Your Needs
We begin by thoroughly understanding your business objectives, target audience, and the specific questions you need answered. This foundational step ensures our visualizations are directly relevant and impactful.
Data Integration & Preparation
Our experts handle data collection, cleaning, and integration from various sources, ensuring accuracy and consistency. We prepare your data to be visualization-ready, eliminating inconsistencies.
Design & Development
Leveraging industry-leading tools, we design and develop custom dashboards and reports that are not only visually appealing but also highly functional and user-friendly, promoting effortless data exploration.
Training & Support
We provide comprehensive training to your team on how to effectively use and interpret the dashboards and reports. Our ongoing support ensures you maximize the value of your data assets.
Continuous Optimization
The data landscape is always evolving. We offer continuous optimization services, updating your visualizations to reflect new data sources, business goals, and technological advancements.
Key Benefits of Effective Data Visualization
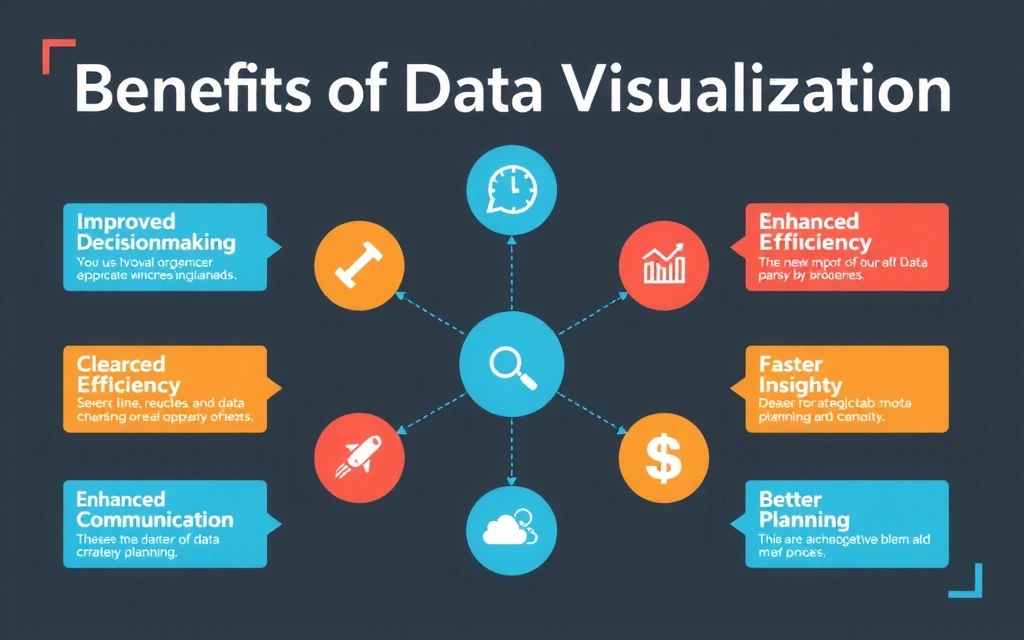
- Faster Insights: Quickly identify patterns, trends, and outliers that would be invisible in raw data, leading to quicker insights and agile responses.
- Improved Decision-Making: Empower leaders with clear, evidence-based information for more informed and confident strategic decisions.
- Enhanced Communication: Bridge the gap between technical data and business understanding, making complex information accessible to all stakeholders.
- Increased Efficiency: Automate reporting processes, freeing up valuable time and resources that can be reallocated to more strategic initiatives.
- Better Performance Monitoring: Keep a constant pulse on your business performance, allowing for proactive adjustments and continuous improvement.
- Identify Opportunities & Risks: Spot emerging market trends, customer behavior shifts, and potential operational risks before they escalate.
Our Expertise in Visualization Tools
We leverage a wide array of industry-leading data visualization tools to ensure the best fit for your specific infrastructure and needs.
Tableau
Power BI

Qlik Sense
Looker Studio
Our team is also proficient in developing custom visualizations using libraries like D3.js, Chart.js, and Plotly.js for highly specific and unique requirements, ensuring no data story goes untold.
Ready to Visualize Your Data's Potential?
Don't let complex data obscure your path to success. Partner with AnalyticsAsia.digital to transform your data into clear, actionable insights that drive growth and innovation.
Get a Free Consultation